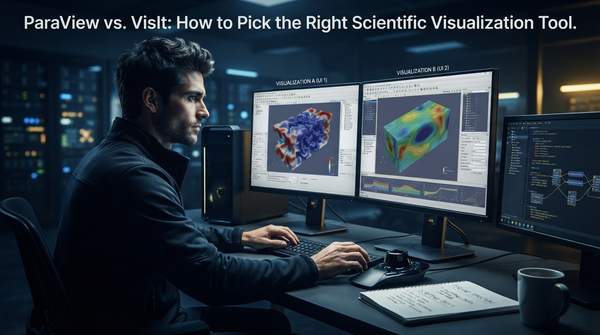
The short answer: choose VisIt if your work centers on interactive, plot-focused exploratory analysis and publication-quality visuals, especially with molecular data. Choose ParaView if you need complex, reusable analysis pipelines, automation, or in-situ visualization wired directly into a running simulation. Both are free, open-source tools built on the same VTK foundation and both scale from laptops to supercomputers, so the decision hinges less on raw capability than on which workflow philosophy matches how you actually work.
ParaView vs. VisIt: A Quick Comparison
ParaView and VisIt share deep roots. As an account of the two tools' origins by researchers involved in their development recounts, both emerged from US Department of Energy initiatives—VisIt from DOE/Lawrence Livermore ASCI-era efforts, ParaView from Kitware working with Los Alamos. That shared heritage matters: because both tools sit on VTK, their core visualization capabilities overlap heavily, including client-server operation, parallel rendering, and the ability to handle datasets ranging from a laptop to a full supercomputer.
The real differences are philosophical. A comparative analysis by Tomas Delgado on matforge.org frames it as a split between VisIt's intuitive, plot-focused interface and ParaView's pipeline-based, filter-driven model. That single design choice cascades into everything else: how quickly a new user becomes productive, how easily work is automated, and how naturally each tool fits a given scientific domain.