
Data Analysis
3 articles
Computational Science & Software
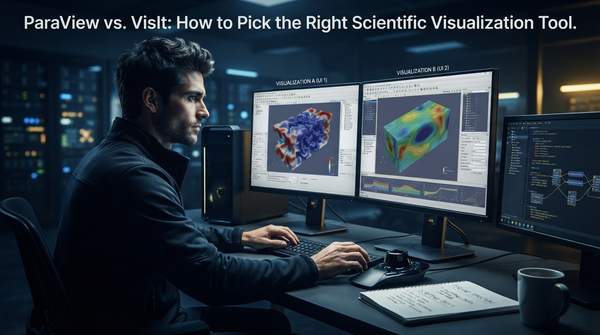
ParaView vs. VisIt: How to Pick the Right Scientific Visualization Tool
ParaView and VisIt are powerful, free scientific visualization tools sharing a common VTK foundation, but they differ significantly in their workflow philosophies. Choose VisIt for intuitive, plot-focused exploratory analysis and publication-quality visuals, or ParaView for complex, reusable analysis pipelines and in-situ simulation integration.
Yasmin Haddad·October 24, 2026

Computational Science & Software
What are the core principles of scientific data visualization for research?
A significant study revealed that 30% of graphs published in the prestigious journal Science contained at least one error.
Yasmin Haddad·September 16, 2026

Cosmos & Physics
Metrics' Inevitable Weakness Undermines Green Progress in 2026
After a decade of diligently tracking personal metrics—heart rate, steps, sleep—one author admitted gaining virtually no self-knowledge, as reported by Technologyreview .
Dr. Evelyn Reed·June 19, 2026